Dr. Zoomie – every now and again I hear about a big debate in radiation safety about radiation health effects. I guess some folks think that there’s no safe level of radiation exposure and some who say that below some limit there’s just no effect at all. What I don’t understand is how that can not be known – can’t they use epidemiology to figure that out?
So…say you’re standing in a silent room – so quiet that you can hear the faintest whisper. Without any outside noise we can easily hear every whisper, every murmur, even if we can’t quite understand the words – with a little more volume we can easily understand what’s being said – the information that’s being conveyed. But what if you’re in a crowded room? Or a stadium when the home team scores? How loud does a voice have to be to be heard – and how much louder to be understood? In general, as your environment grows noisier you’ll need a stronger voice – more decibels – to be heard and to be understood.
Statistics are like that; and because epidemiology relies so heavily on statistics, it’s like that as well. The more “noise” there is in the data, the harder it is to notice and understand a small signal. And the more variability in the noise level the harder it is to tell if it’s a whisper you heard or just a momentary increase in the background noise, as happens from time to time. With the epidemiology of radiation-induced cancer…the normal rate of cancer is the background “noise,” the extra cancers from radiation exposure are the “signal,” and what epidemiology aims to do is to determine when an uptick in cancer rates is due to radiation exposure rather than a normal small statistical fluctuation.
This is a common problem with any sort of statistical process; say I’m counting a smear wipe for contamination and I get a count rate of 6 cpm when background is normally 5 cpm. Did I detect contamination, or was it a statistical fluctuation in background radiation levels? And if it’s the latter, how many “extra” counts do I need to detect before I can be sure that I’m seeing actual contamination? Similarly, cancer occurs randomly and the number of cases varies from year to year in any population – epidemiology tells us how much variability we should expect to see. When the cancer rate rises above that level then we can start to view the higher rates as being real, just as when a voice becomes loud enough to stand out above the general babble then we can hear what it has to say.
The thing with cancer is that it’s not a rare disease – there were nearly 20 million cases of cancer globally in 2022 and 9,743,832 fatalities; in 2021 there were 19.3 million cases of cancer, of which 9.9 million were fatal. So in 2022 the world saw nearly 700,000 more cancers and 200,000 fewer cancer fatalities than in the previous year; how do we interpret these numbers? Just looking at the numbers do we say that we needed to worry more about getting cancer in 2022 than in 2021, that cancer became less deadly in 2022 than in 2021, or that we just don’t have enough information to draw any conclusions? Does it matter that the world had 67 million more people in it in 2022 than in 2021, that there was more meat eaten by the world’s population, that global energy use (and use of electricity) increased, that more people had more medical care and more medical imaging…and on and on through hundreds of factors that might – or might not – influence a person’s risk of getting cancer and the total number of cancers to be diagnosed?
We’ll come back to this shortly – for now, let’s take a moment to talk about the risk that radiation might cause a cancer.
As a good first approximation, exposure to 100 rem (1 Sv) over a lifetime increases a person’s risk of getting a fatal cancer by 5%. To put this number in perspective, I’ve been working with radiation and (at times) nuclear reactors since 1981 and I have a total exposure of about 3 rem, and most radiation workers have similar exposure histories. It’s hard to get an exposure of 100 rem. But a more likely exposure of 10 rem (probably from medical procedures) gives a person an added risk of only 0.5% – five additional cancer deaths for every 1000 people exposed. And here’s the thing – in any group of 1000 people (in the US) we expect that about 250 of them will eventually die of cancer. Can we “see” the difference between 250 and 255 above the normal variability? Well…maybe not in a group of 1000 people; five “extra” deaths spread over a few or several decades doesn’t make much of a blip in the numbers. But if we study, say, 1000 such groups and we see the same sort of slight excess in each of them…well, now we’re getting somewhere!
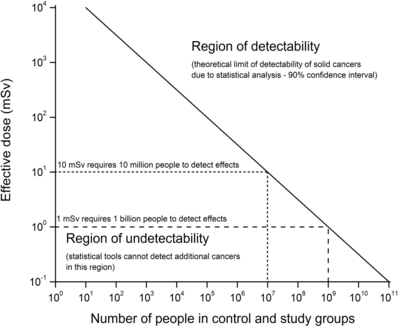
So to see if 10 rem will increase a person’s risk of getting cancer we need to study more than 1000 people, but probably not as many as a million (it turns out that 100,000 should do the trick). Here’s the thing, though – since the risk of getting cancer drops with lower amounts of radiation to which one is exposed, as the dose is reduced we need to study more people. If we have to study 100,000 people to see if 10 rem will cause cancer then we’ll need to study 10 million people to see if 1 rem is risky. And when we’re looking at numbers like that, it’s not surprising that it’s hard to get solid data because it’s hard to study even tens of thousands of people for a lifetime, let alone tens of millions. At some point the logistics and cost and time become overwhelming – which is perhaps the main reason that we just don’t know what happens at low levels of radiation exposure. But having said that, we can say that, even if we don’t know the exact risks, they’re lower than, say, the risks from driving.
Because of this uncertainty it would seem to make sense to assume the worst – in this case, that the risk from radiation exposure scales directly with the exposure itself and that every little bit of radiation exposure carries with it a bit of risk – this is the linear, no-threshold (LNT) hypothesis. And, in fact, LNT is the basis for radiation safety regulations around the world.
So let’s do a little thought experiment. Let’s say that we find solid scientific evidence that, below a dose of 10 rem there is absolutely no effect on our health at all. If we assume an average person lives for 80 years, that means that we could receive a dose of 0.125 rem annually without risk that it will harm us. To be safe, we’d likely reduce that to 0.1 rem annually…which is exactly the limit we already have for members of the public. The way that I practice radiation safety won’t change in the slightest if we find definitive evidence of a dose threshold of 10 rem. To me, this fascinating scientific debate is sort of a moot point. Which is sort of nice!
I used to spend a lot of time getting caught up in this – what’s called the LNT debate – because I wanted to know for sure what was happening. But knowing that the risks – whatever they are – from very low levels of radiation exposure are so slight, and that, whether they’re very small or nonexistent doesn’t have an impact on how I practice radiation safety has made me realize that this scientific debate doesn’t make much of a difference on a practical, day-to-day level. Which leaves me free to worry about other things – like the sealed source inventory and leak tests I need to do.